Application Group Bandwidth by Service Provider
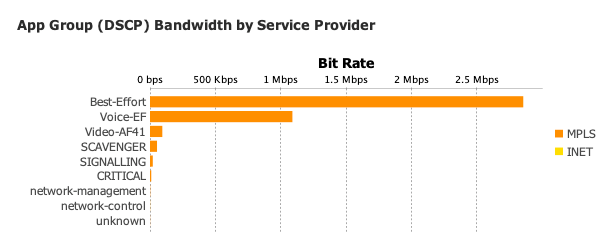
Application Group Bandwidth by Service Provider charts the highest bandwidth applications by application group. The application groups are charted in a stacked bar chart format, color-coded to indicate the various service providers associated with the application groups. The service providers are interface attributes that are user-defined in the Device/Interface tree view and application groups are attributes that are user-defined in the Configure Application Groups section of the PfRv3 Dashboard.
There are three charts in the Service Provider section of the PfRv3 Dashboard: Top 10 Alerts by Service Provider, Service Provider Utilization by Application Group and Service Provider Utilization by Site.